The world in 3000 BC
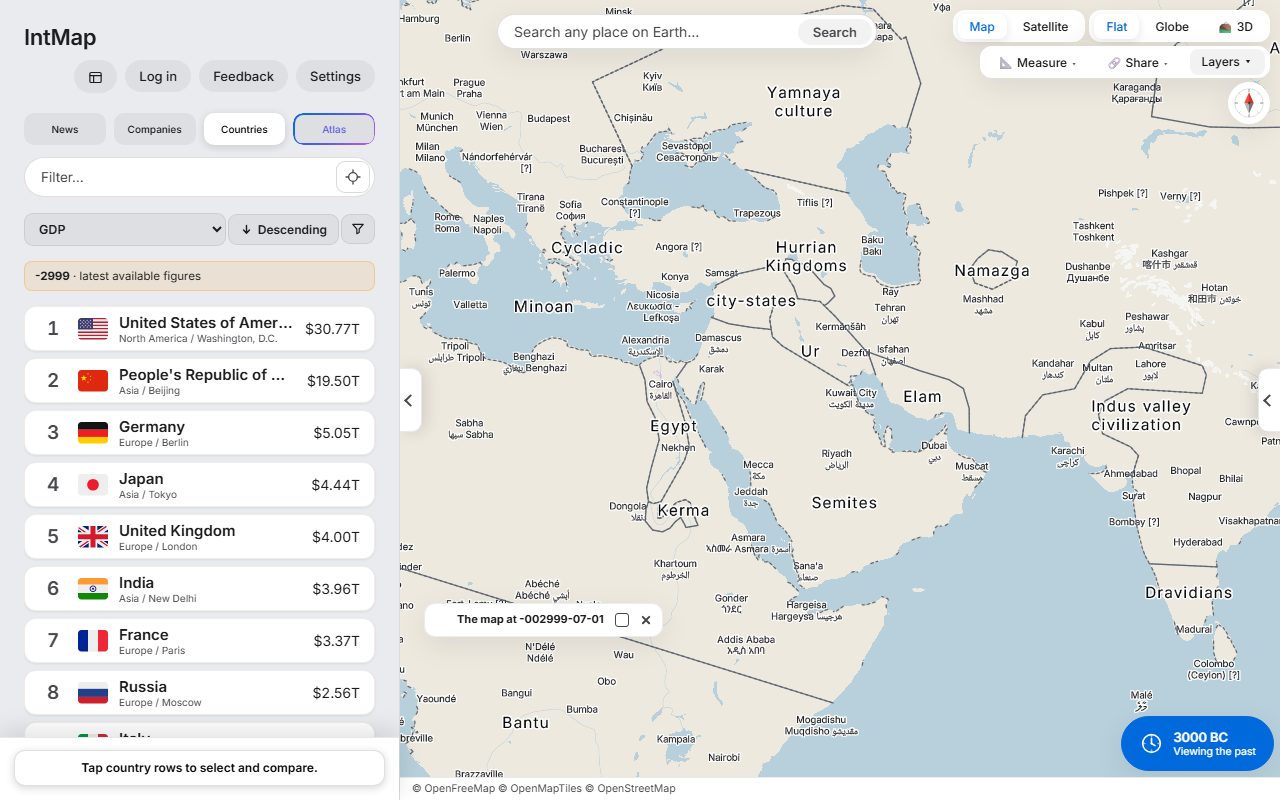
Egypt, Ur, the Indus valley civilisation and Minoan Crete — the historical-basemaps snapshot for 3000 BC.
Open this map →IntMap puts history and present-day data on one map, names the source of every layer and explains what each simulation computes.
Open a GeoJSON, KML, GPX or CSV file (with latitude and longitude columns) on the map, next to IntMap's layers. The file is read by your browser.
The data sources page lists every dataset with its licence; the computation page says what each simulation computes and from what.
Any view becomes a link or an embed code (480×320, 640×400 or 960×600, or full width) for a report, a website or slides.
Share, then Cite, gives the view as a reference in APA, Chicago, SIST 02, BibTeX or RIS — the date the map shows, the day you read it and the link that reopens it — and the citation each data source asks for.
Save the borders of any drawn date as GeoJSON. Each shape carries its record and row, its dates and who stated them, its identifiers (OpenHistoricalMap relation, Wikidata, Seshat) and its licence. Shapes under non-commercial terms are left out and named, with where to get them.
Press any border to see which record drew it, who stated its dates and how precise its outline is, and report it from there if it is wrong.
Write to us with the dataset, its licence and how it should be credited. We will tell you whether it can be added and how it would be shown. A dataset is added only with its source, licence and credit, and only if its licence allows it.
Egypt, Ur, the Indus valley civilisation and Minoan Crete — the historical-basemaps snapshot for 3000 BC.
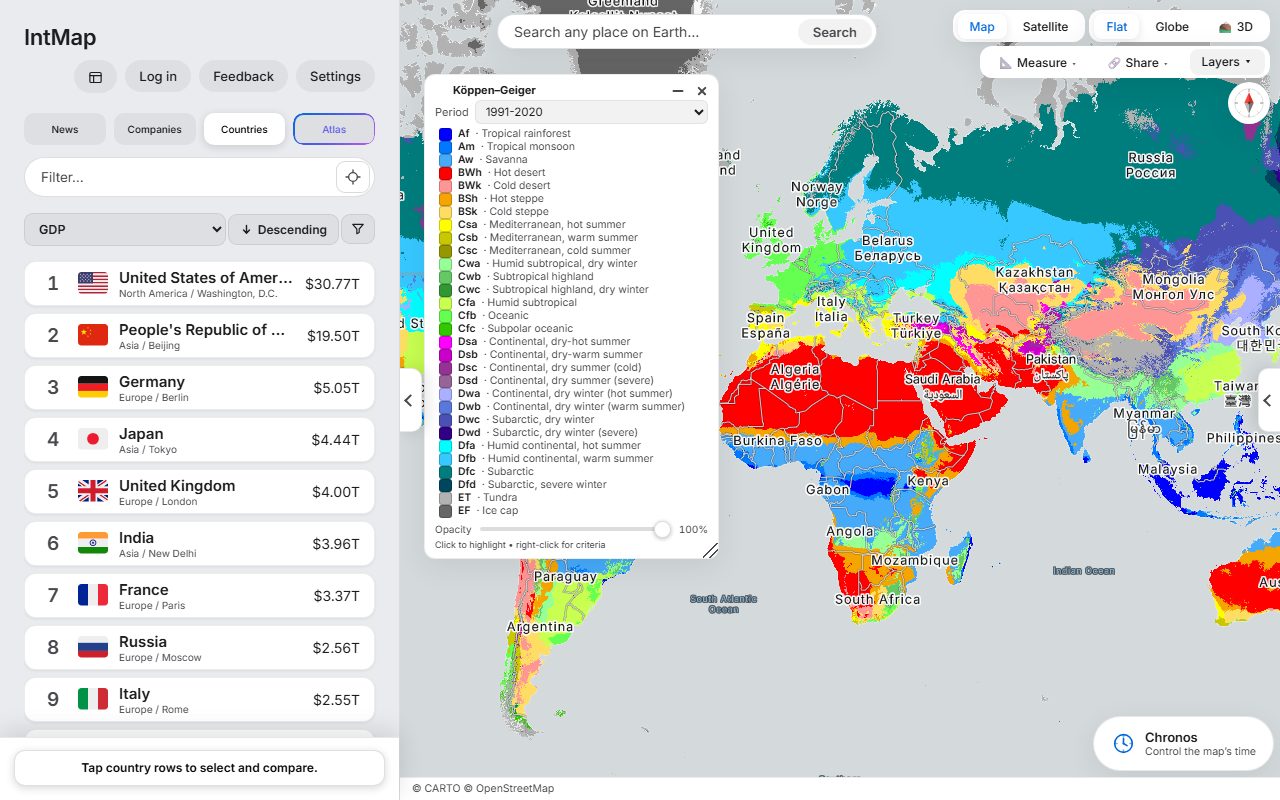
Open this map →The Köppen–Geiger climate classification of Beck and colleagues, for 1991–2020.
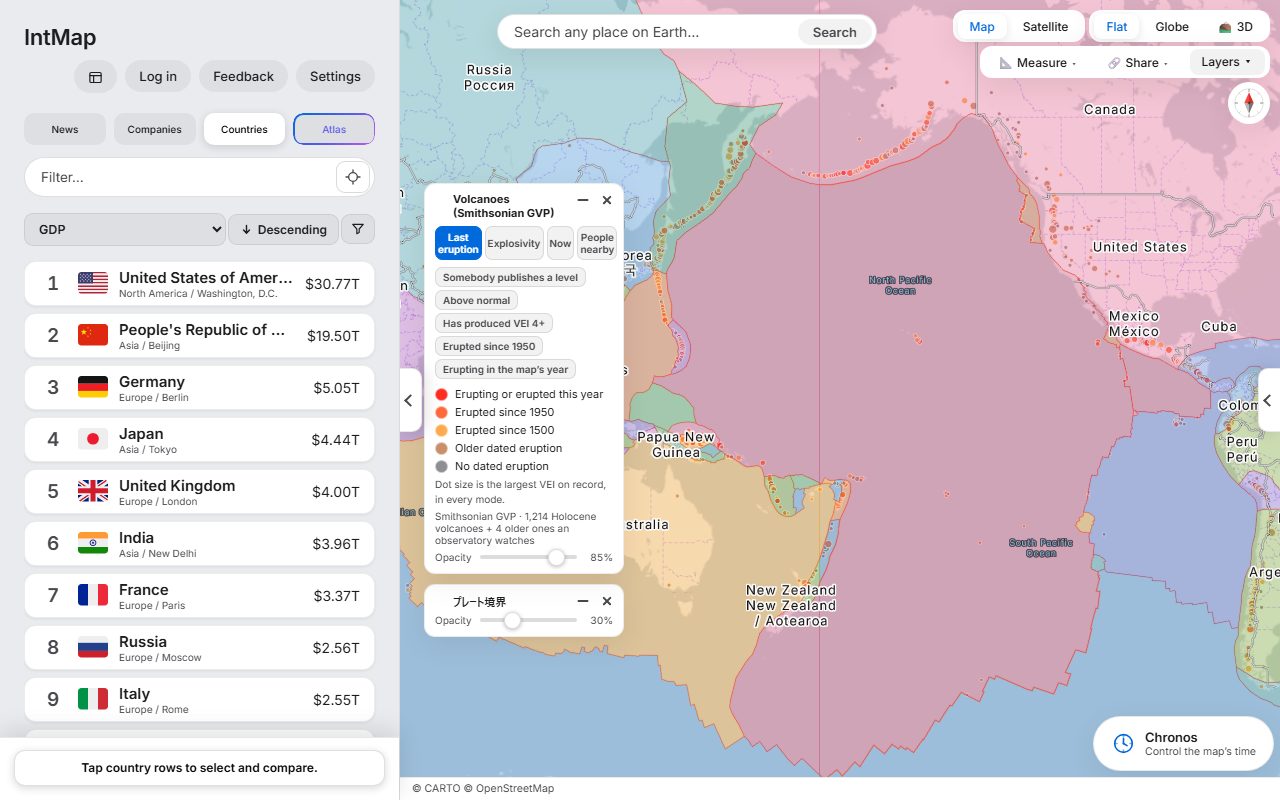
Open this map →Holocene volcanoes from the Smithsonian Global Volcanism Program, over the plate boundaries of Bird (2003).
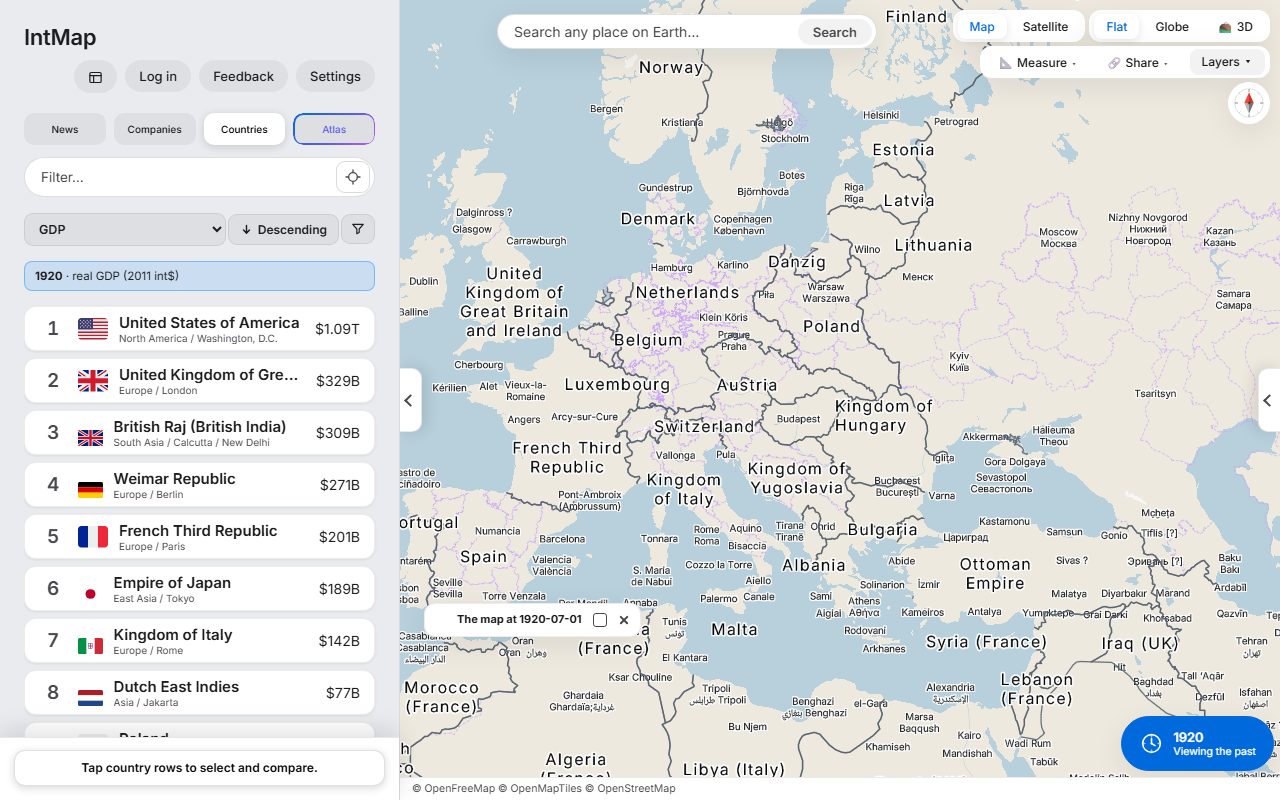
Open this map →After the First World War: Poland, Czechoslovakia, Finland, Estonia, Latvia and Lithuania are on the map, and Austria and Hungary are two countries.
Open this map →These are example maps anyone can open — not customer stories. IntMap has no published case studies yet.
Non-profit research use of IntMap's software is free (LICENSE §2). If your project is commercial or you are unsure, ask us before you publish.
Cite the underlying datasets first — they carry the authorship — and IntMap as the tool that drew them, with the link to the view. The Cite tab under Share writes both for the view you have open: the reference in APA, Chicago, SIST 02, BibTeX or RIS, and the citation each source asks for.
There is open data as static JSON with the licence of each dataset (api/v1/), an embed API that moves an embedded map from your page, and the borders of a date as GeoJSON from the Cite tab. The developers page describes them; write to us if you need something else.
IntMap is free to use and is paid for by donations. There is no paid plan today. A paid plan for heavier use of the AI features may come later; what it would include and cost has not been decided, and anything free today stays free.
Every dataset keeps its own licence and credit; the data sources page lists them. The map's credit line names the sources of what is drawn and stays visible in an embed. IntMap's own software is free for personal, educational and non-profit research use; commercial use of the software needs a separate licence (LICENSE §3). If you are unsure which applies to you, ask before you publish.
Data sources →