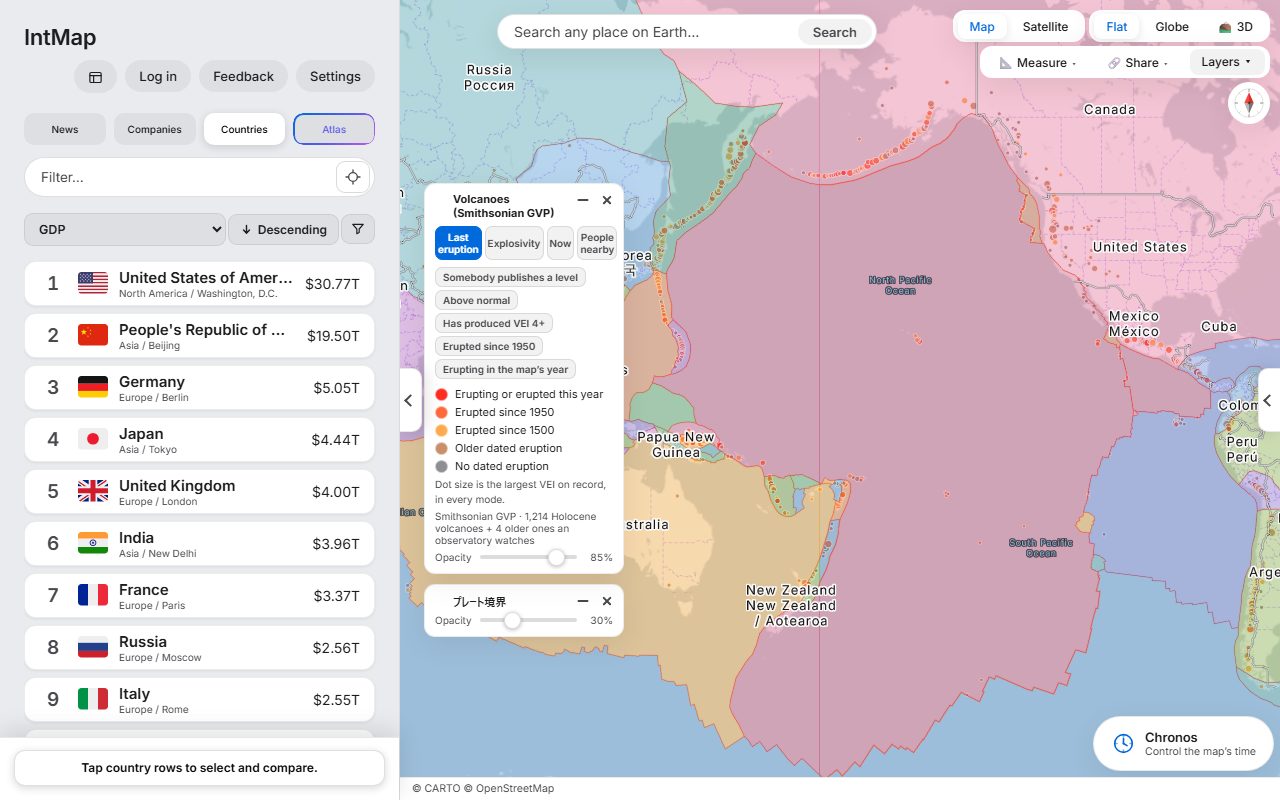
Volcanoes and plate boundaries
Holocene volcanoes from the Smithsonian Global Volcanism Program, over the plate boundaries of Bird (2003).
Open this map →IntMap puts each news event where it happened — one pin per event, not one per article — and lets you lay the world around it: borders, people, climate and history.
Headlines and summaries are in English. Free, and no account is needed to read them.
Articles that report the same event are gathered into one event, and the map shows one pin where it happened — down to a city, a port or a border crossing — for news from the last 72 hours.
Open an event to read what happened in the words each outlet published, line by line with its name, with the key figures and where the reports agree and differ. IntMap does not say which outlet is right.
Turn on layers to see what surrounds the place — where people live, borders, climate, cables, railways — and move the clock to see how the borders stood in another year.
Signed in, press «Ask Atlas» on an event: Atlas opens on that event, suggests questions about it and answers on the map itself.
Ready-made maps of the world behind the headlines. Each picture is a screenshot of IntMap, and each opens as pictured.
Holocene volcanoes from the Smithsonian Global Volcanism Program, over the plate boundaries of Bird (2003).
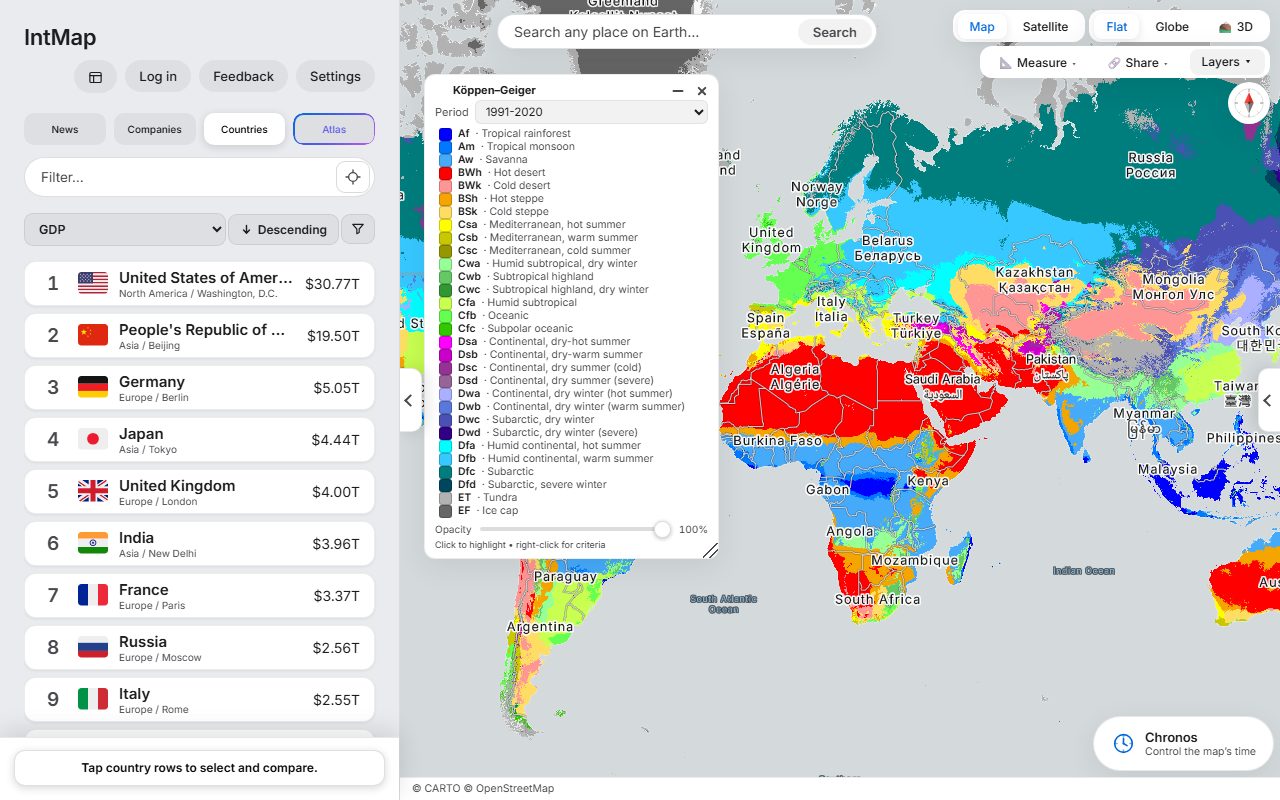
Open this map →The Köppen–Geiger climate classification of Beck and colleagues, for 1991–2020.
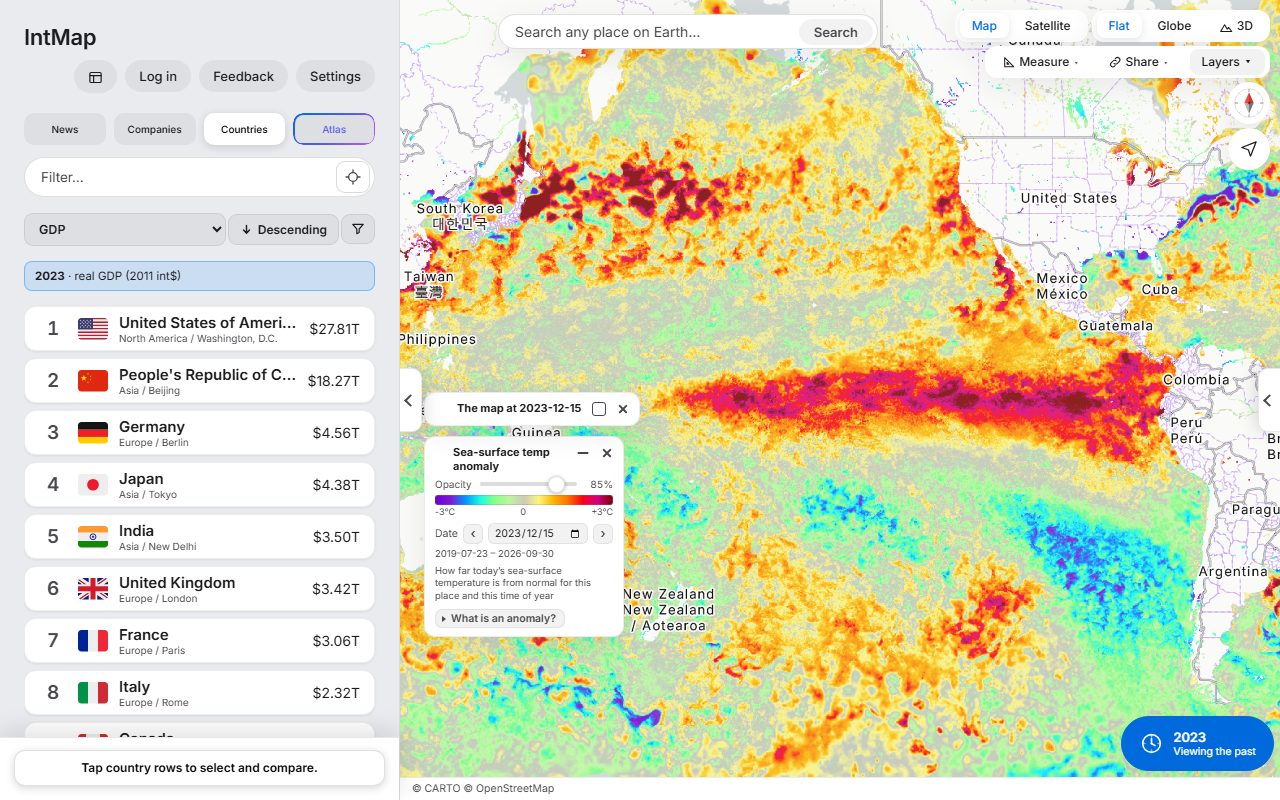
Open this map →How much warmer or cooler than usual the sea surface was that day, at the height of the 2023–24 El Niño: the GHRSST MUR anomaly from NASA JPL, through NASA GIBS.
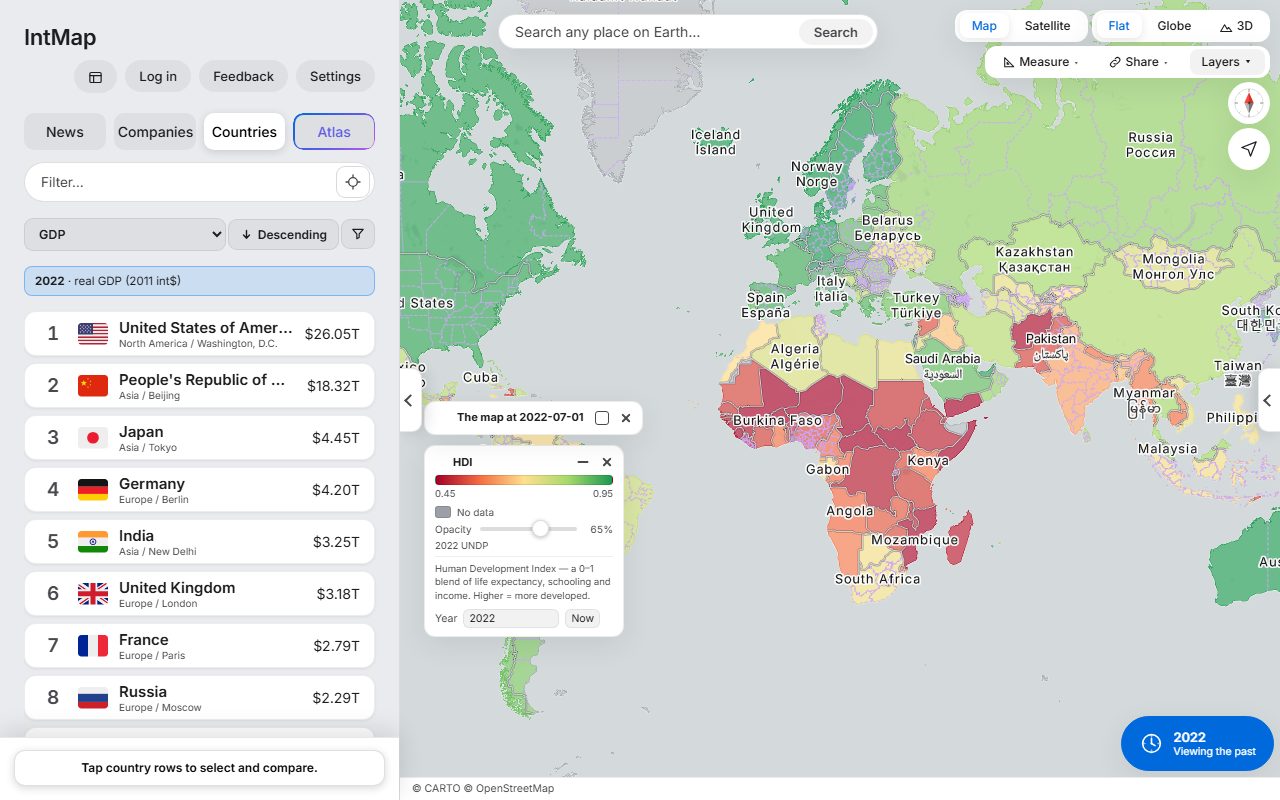
Open this map →Each country coloured by the Human Development Index of the UN Development Programme for 2022 — one number made from life expectancy, years of schooling and income.
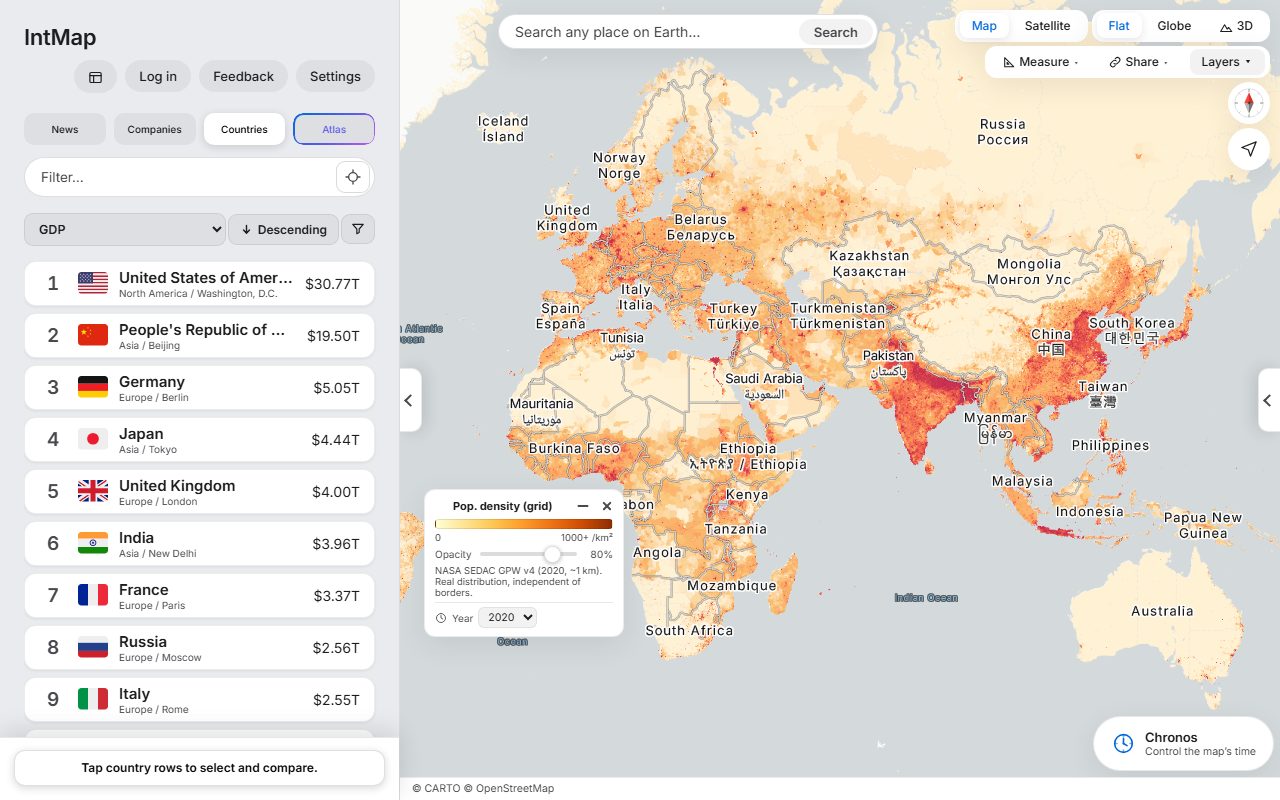
Open this map →Population density from Gridded Population of the World (NASA SEDAC), for 2020.
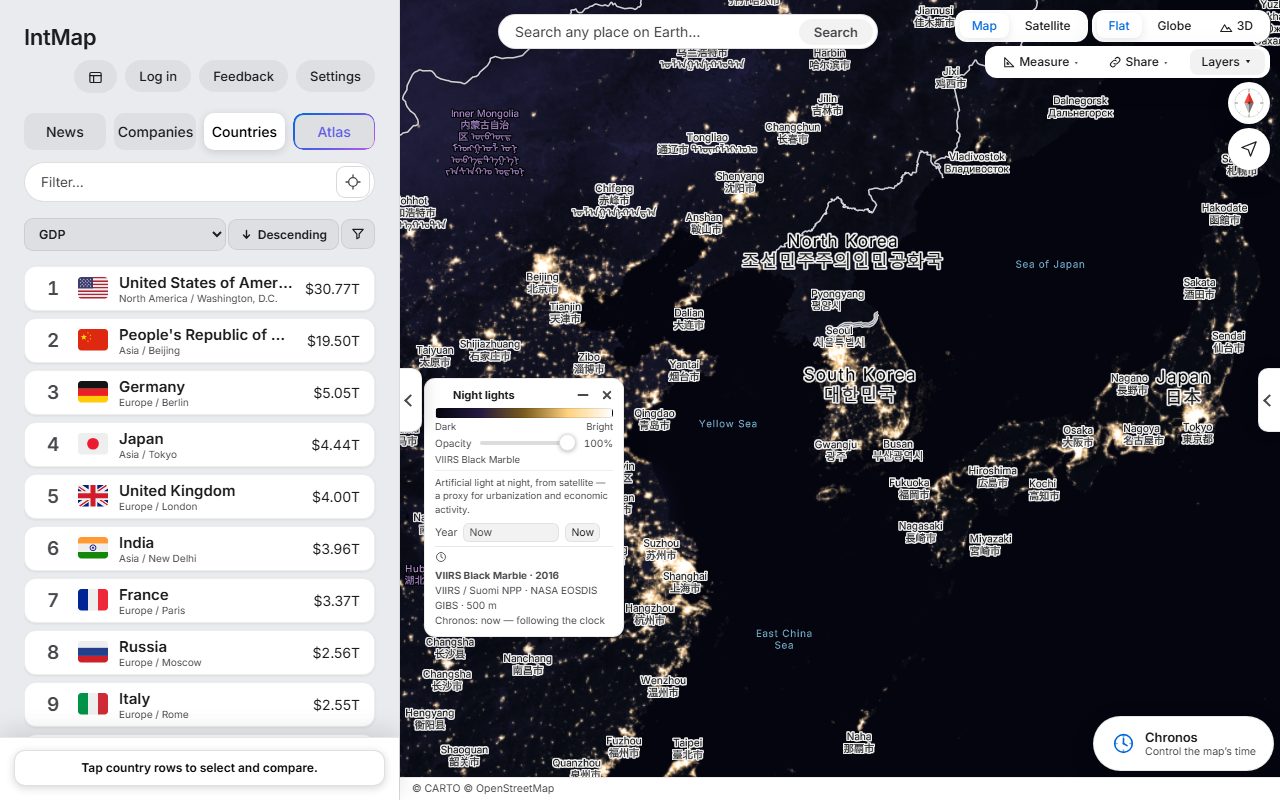
Open this map →The lights of cities, roads and ports seen from space: the VIIRS Black Marble composite of 2016 (NASA).
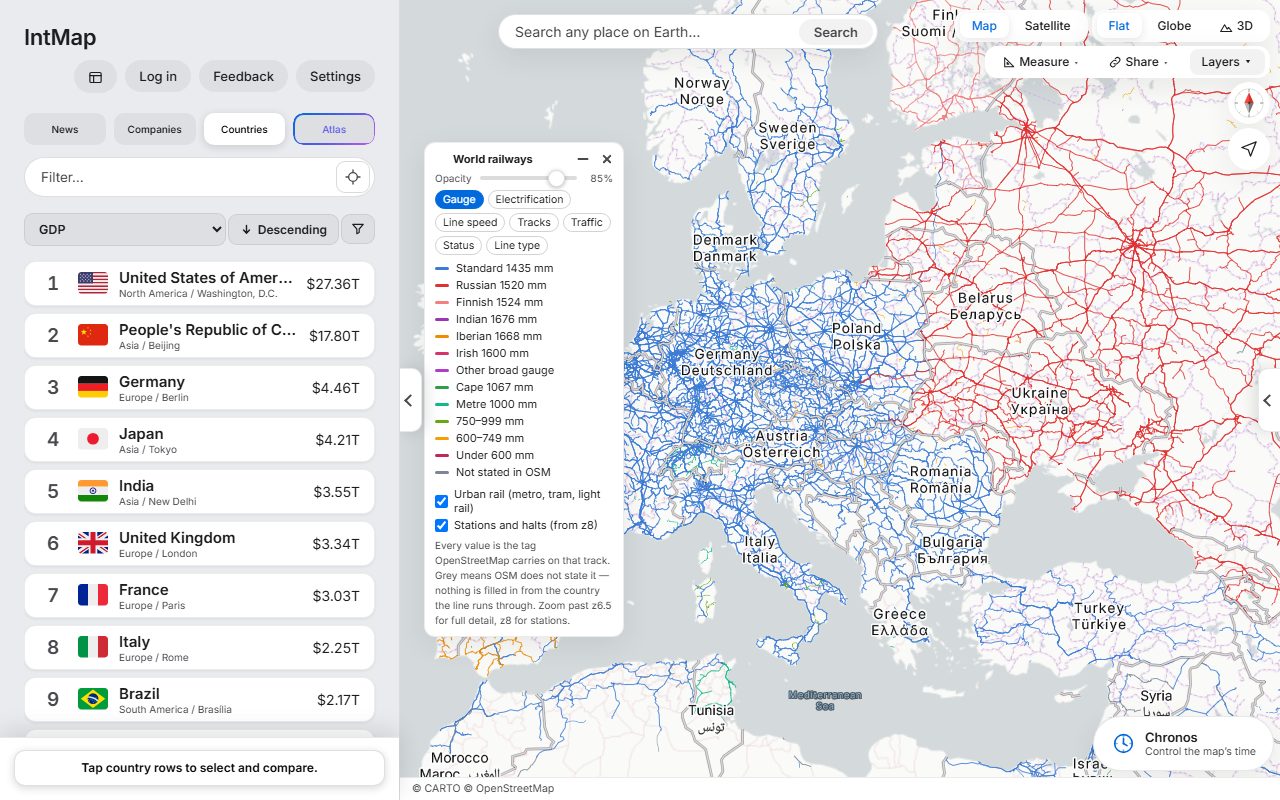
Open this map →Every line coloured by the distance between its rails, as OpenStreetMap records it for that track.
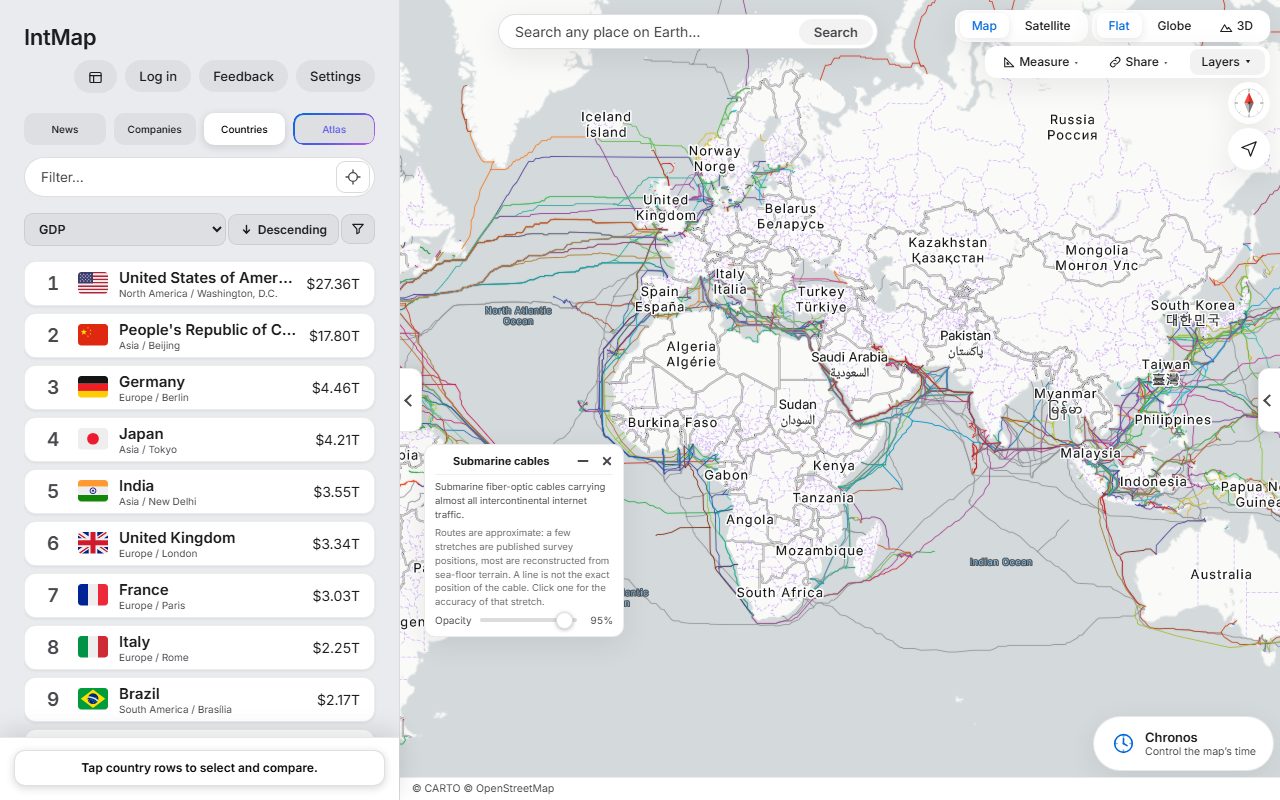
Open this map →The submarine cables that carry the internet between continents: the cables TeleGeography’s Submarine Cable Map lists, on routes reconstructed from the sea floor — a line shows where a cable runs approximately, not exactly.
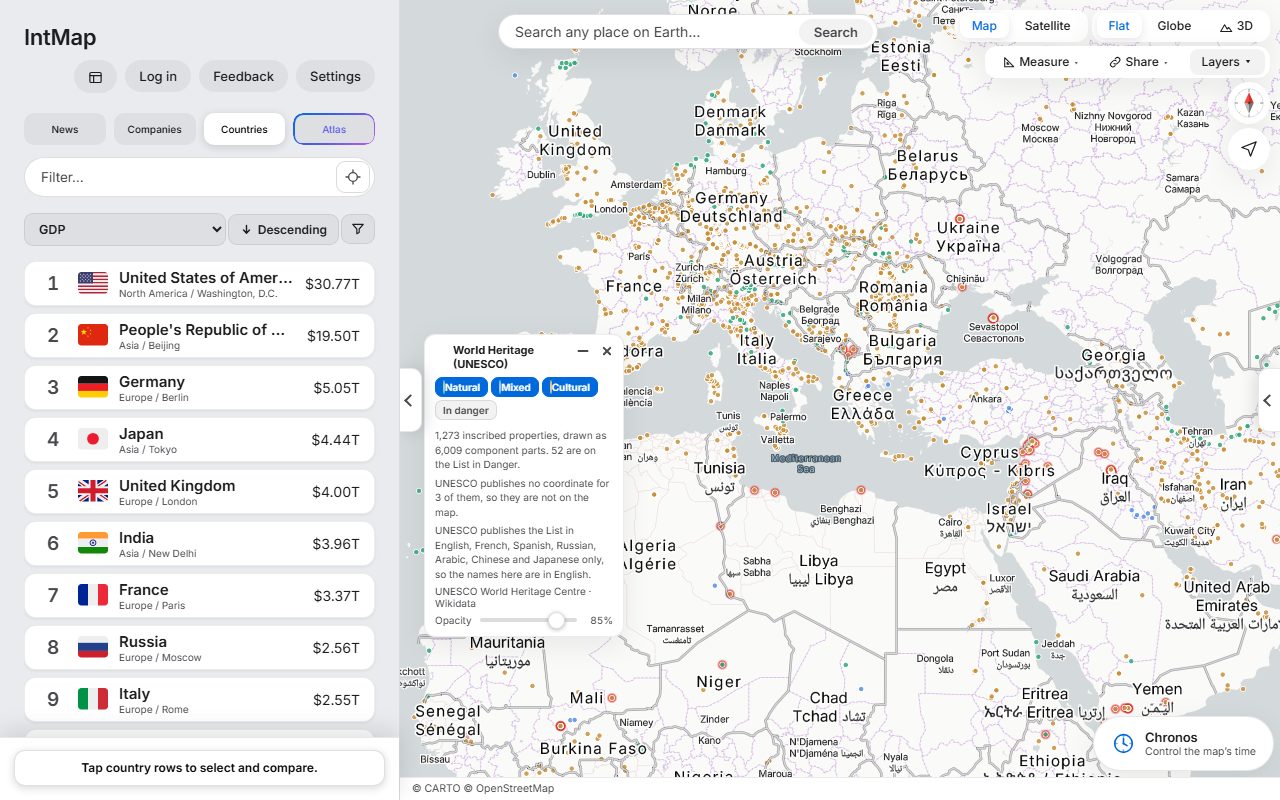
Open this map →Every site on the UNESCO World Heritage List, coloured by whether it is inscribed as cultural, natural or mixed.
Open this map →