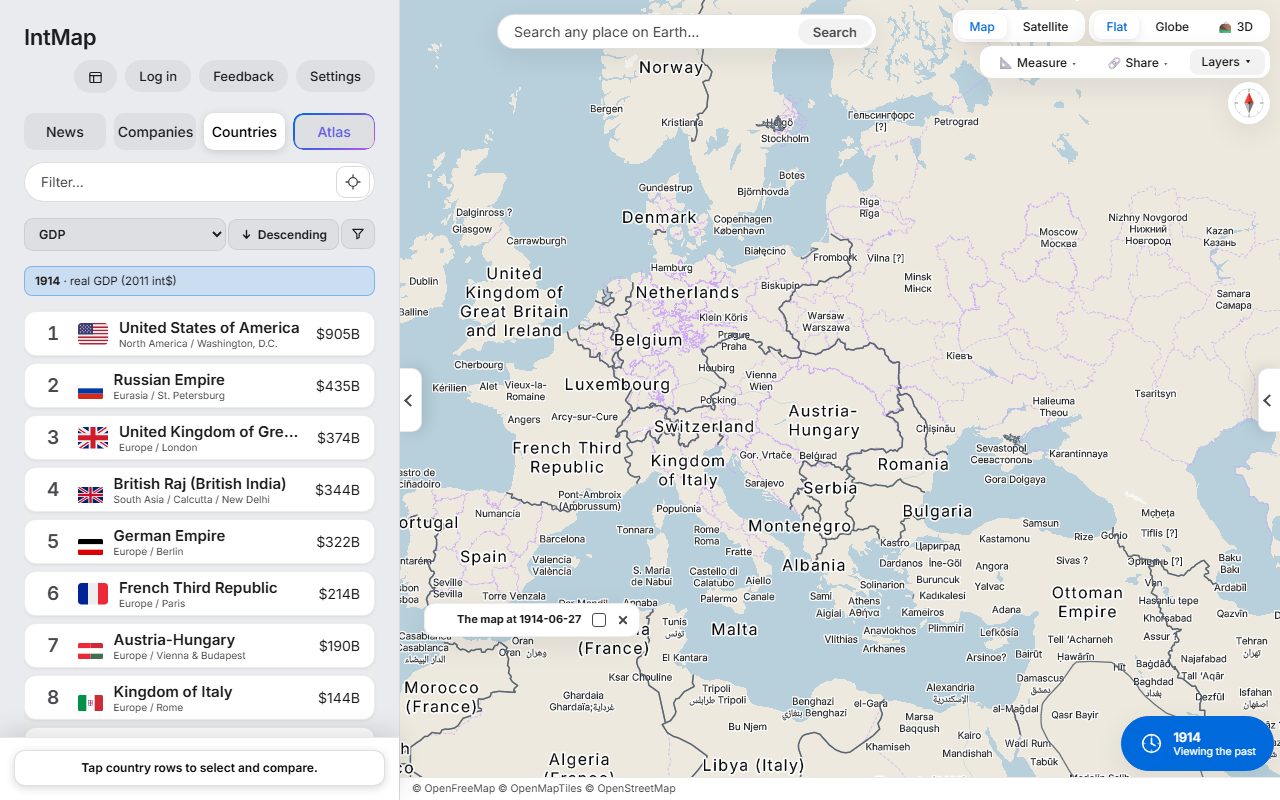
Europe on 27 June 1914
The day before the shots in Sarajevo: Austria-Hungary, Serbia, Montenegro and the Ottoman Empire, with the borders CShapes 2.0 records for that day.
Open this map →A space-time atlas of the Earth
Today’s map carries live earthquakes, rain radar and aircraft. Move the clock to any date from 123,000 BC and the borders follow — and, where the records reach, that year’s city names and provinces.
Every border is drawn from a named record, and every layer names its source.
Free. No account needed to use the map.
The world in 3000 BCOpen this date in the map →
The world in AD 100Open this date in the map →
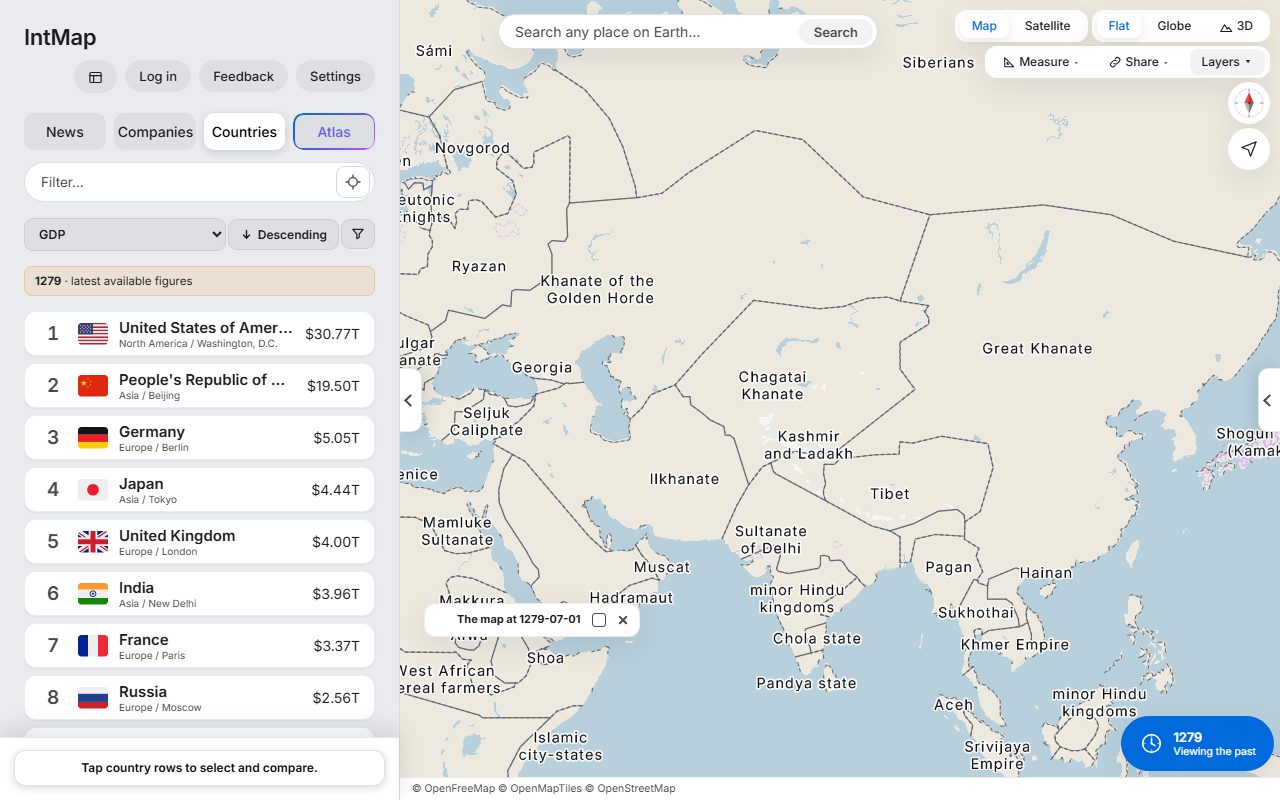
The Mongol world in 1279Open this date in the map →
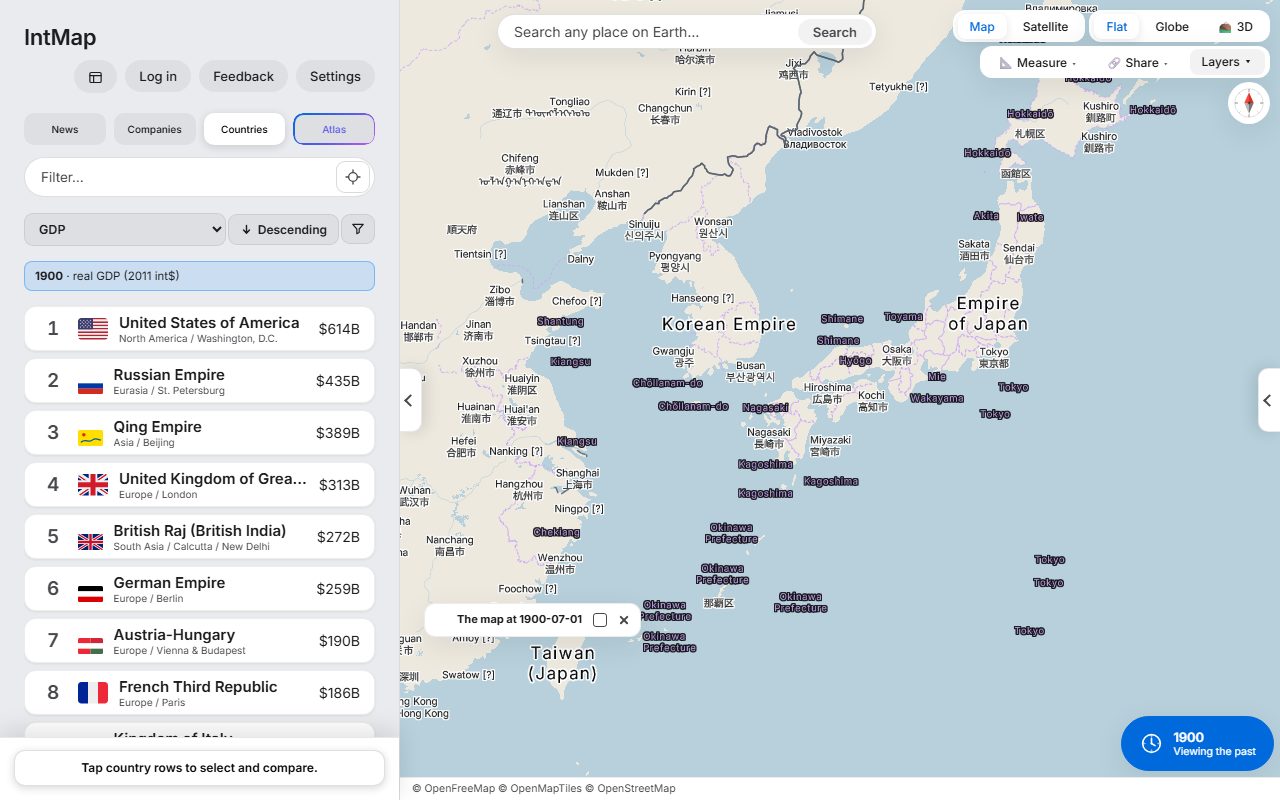
Japan in 1900Open this date in the map →
Europe on 27 June 1914Open this date in the map →
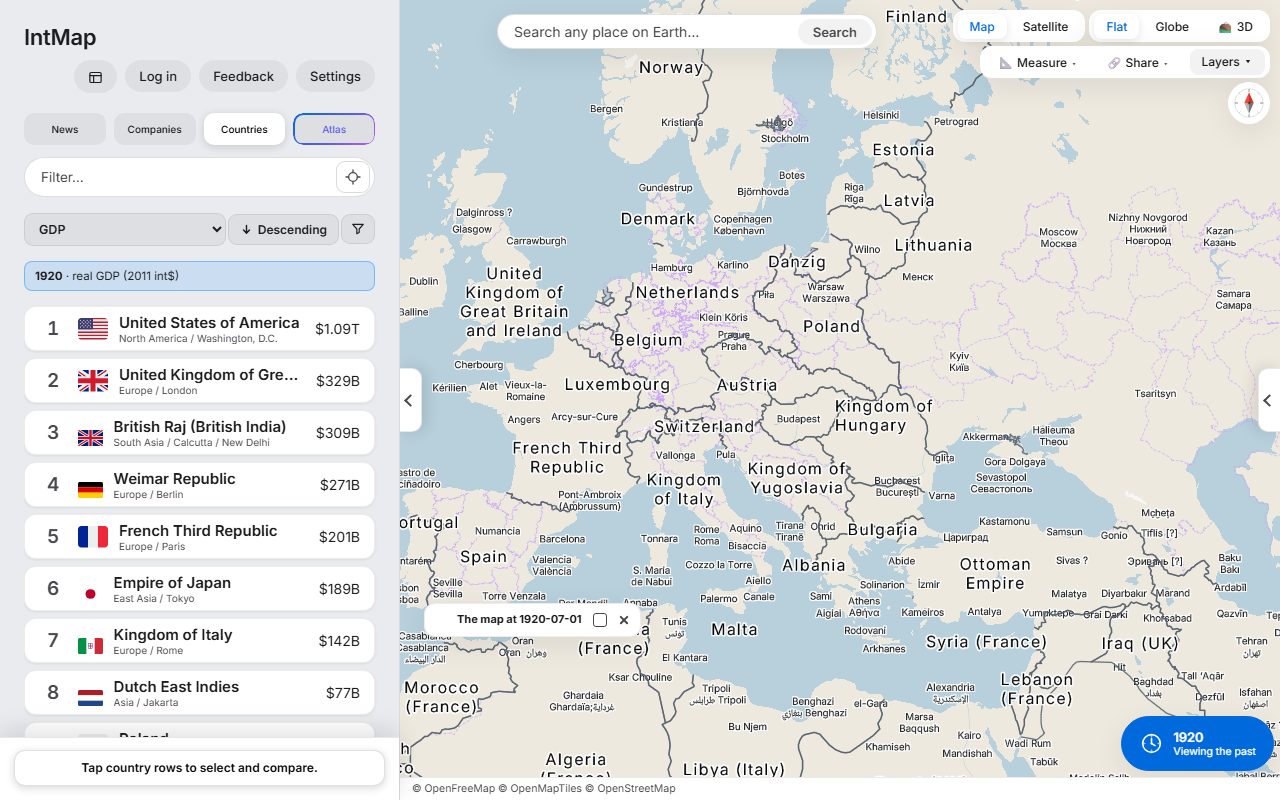
Europe on 1 July 1920Open this date in the map →
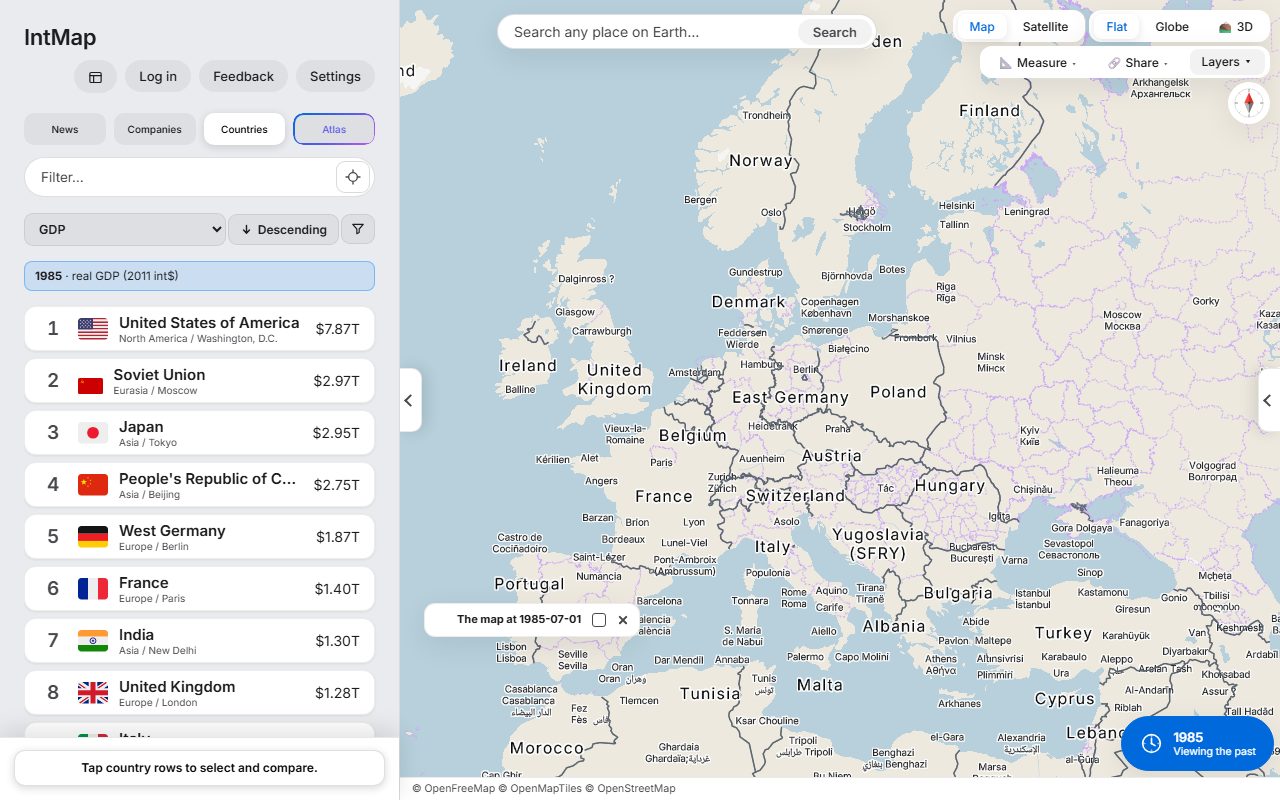
Cold War Europe, 1985Open this date in the map →
Move the clock. Each picture is a screenshot of IntMap at that date.
Each one opens the real map, in the state described.
Today’s map with live rain radar and aircraft. Earthquakes, weather warnings and the news placed where it happened are in Layers and News.
Open today’s mapRead the news on a map →Open the map at a past date and move the clock: the borders change with it, and where the records reach, so do the city names and the provinces. Each border is drawn from a named record.
The Mongol world in 1279
Open the map at this dateBrowse the historical maps by year →Atlas, IntMap’s AI assistant, answers on the map: it switches layers on and moves the camera and the clock. Open the map and choose Atlas in the side bar — on a phone, type into the field at the top. Its suggested questions follow the place and the date on screen. Asking needs a free account, with a daily limit.
Open the map and ask AtlasMove the clock and the map moves with it: country borders day by day from CShapes 2.0 from 1886 to 2019 and from OpenHistoricalMap from 1689 to 1885, year by year from Cliopatria (Seshat Global History Databank, from 3,400 BC) on the ground those leave, and from 54 historical snapshots where none of them speaks — and the countries panel shows the figures for that year where its source has them.
IntMap has 166 layers, and the Data sources page names every organisation whose data they show. Set the clock to a date a source does not describe and that layer is not drawn — the map tells you so, instead of showing today’s data under an old date.
Signed in, you can ask Atlas, IntMap’s AI assistant, in plain language. It answers on the map itself — turning layers on, moving the camera and the clock.
Open a year, compare it with another, and share exactly what you see with one link. Every example below opens in one tap, just as pictured.
Browse the examples →Nothing to install and no sign-up for students: a link opens the same map on every device in the room. Each example comes with a question for class.
Teaching with IntMap →Each news event is a pin where it happened, with what each outlet reported — and the map around it.
Read the news on a map →Put a live map in a blog post or article with one line of HTML: your view, layers and date, with every data credit.
Embed a map →Pick a region and a date and see the names IntMap’s historical map draws there, with the source of every border. Each page opens the map at that place and date.
Browse the historical maps by year →Each picture is a screenshot of IntMap. The link opens the same view, date and layers.
The day before the shots in Sarajevo: Austria-Hungary, Serbia, Montenegro and the Ottoman Empire, with the borders CShapes 2.0 records for that day.
Open this map →After the First World War: Poland, Czechoslovakia, Finland, Estonia, Latvia and Lithuania are on the map, and Austria and Hungary are two countries.
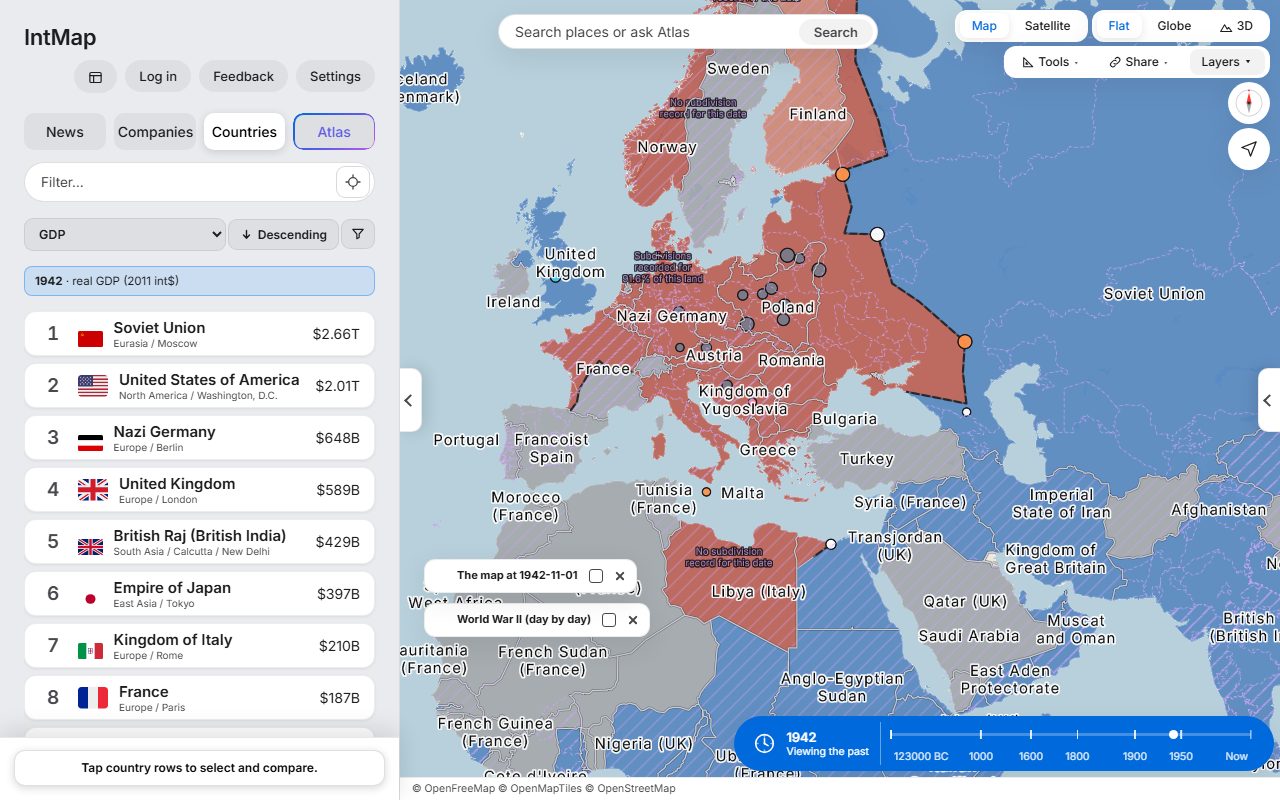
Open this map →Who held which territory on that day, Axis or Allied, from the war record IntMap carries.
Open this map →West Germany and East Germany side by side, with Czechoslovakia, Yugoslavia and the Soviet Union, on the borders CShapes 2.0 records for that day.
Open this map →Japan divided into prefectures, not the old provinces: the domains were abolished in 1871. Taiwan is under Japanese rule, and Korea is the Korean Empire.
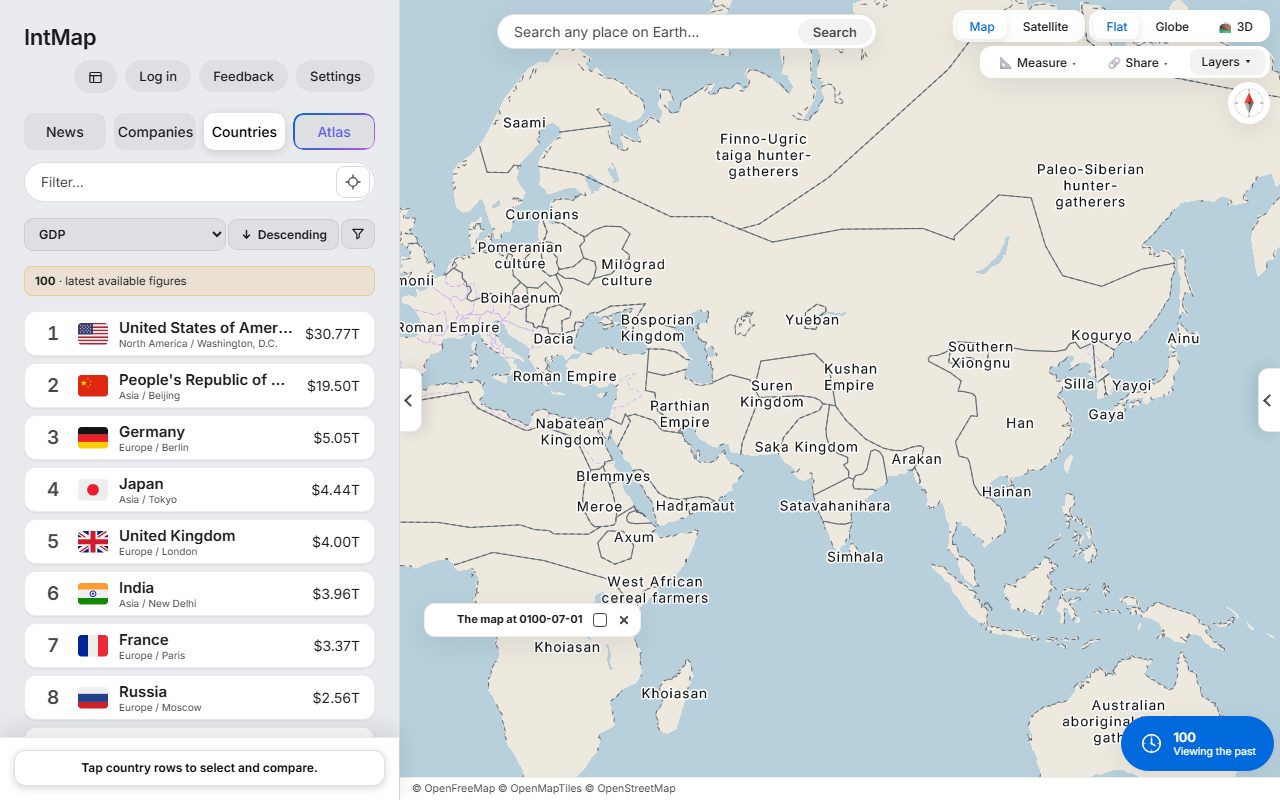
Open this map →The Roman Empire and Han China at the two ends of Eurasia, with the Parthian and Kushan empires between them — the historical-basemaps snapshot for AD 100.
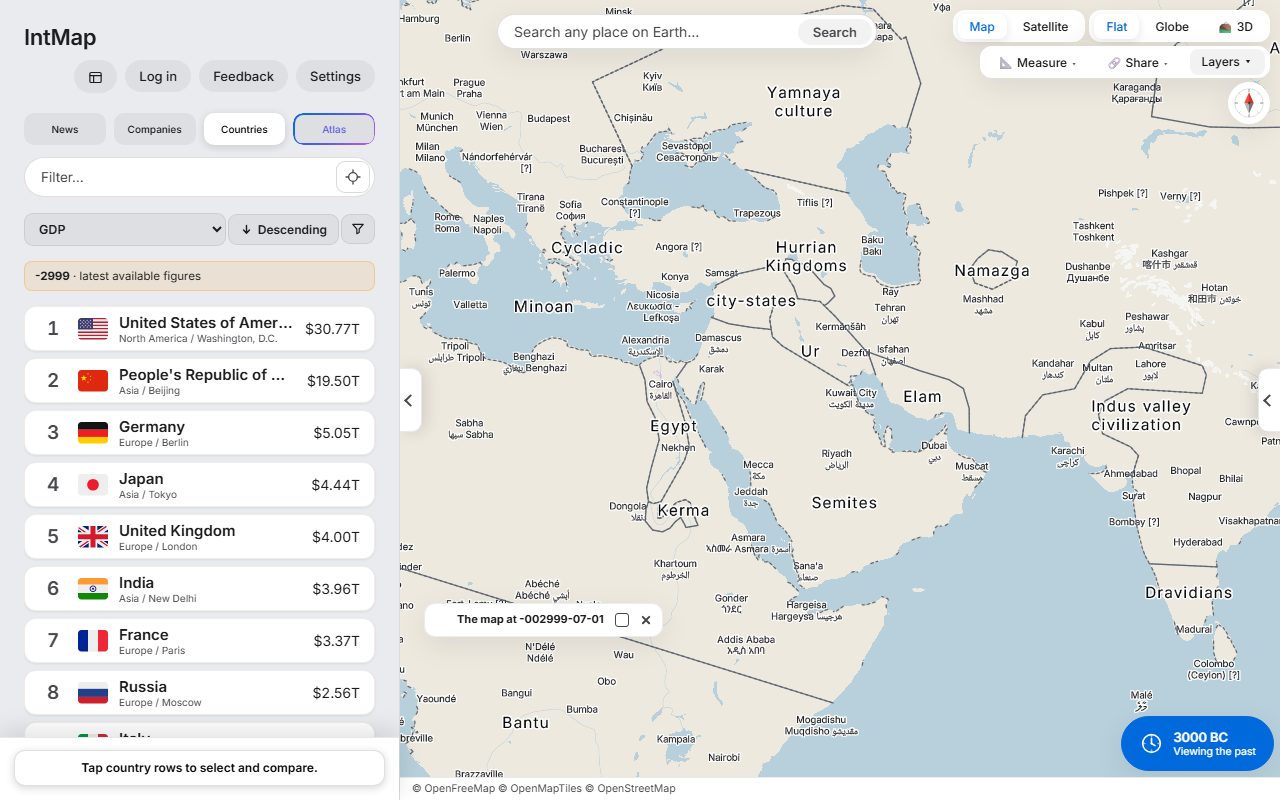
Open this map →Egypt, Ur, the Indus valley civilisation and Minoan Crete — the historical-basemaps snapshot for 3000 BC.
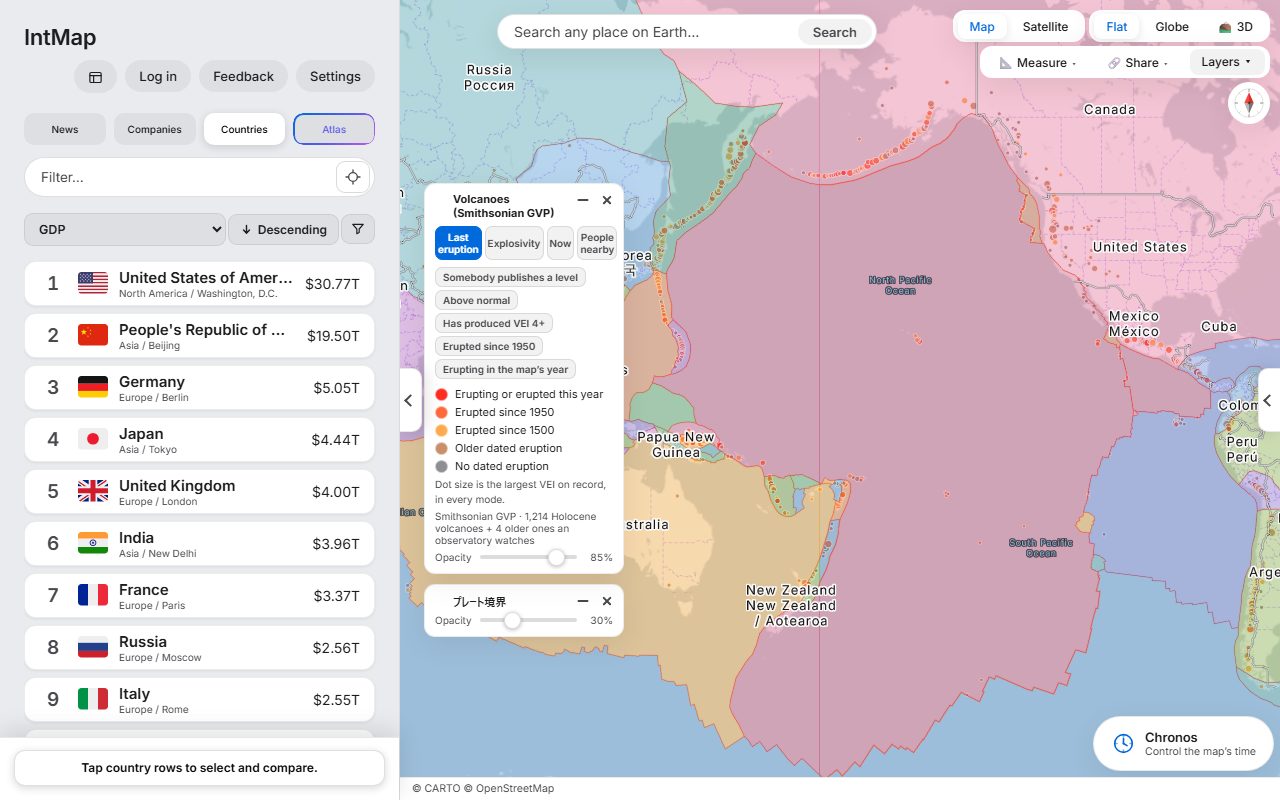
Open this map →Holocene volcanoes from the Smithsonian Global Volcanism Program, over the plate boundaries of Bird (2003).
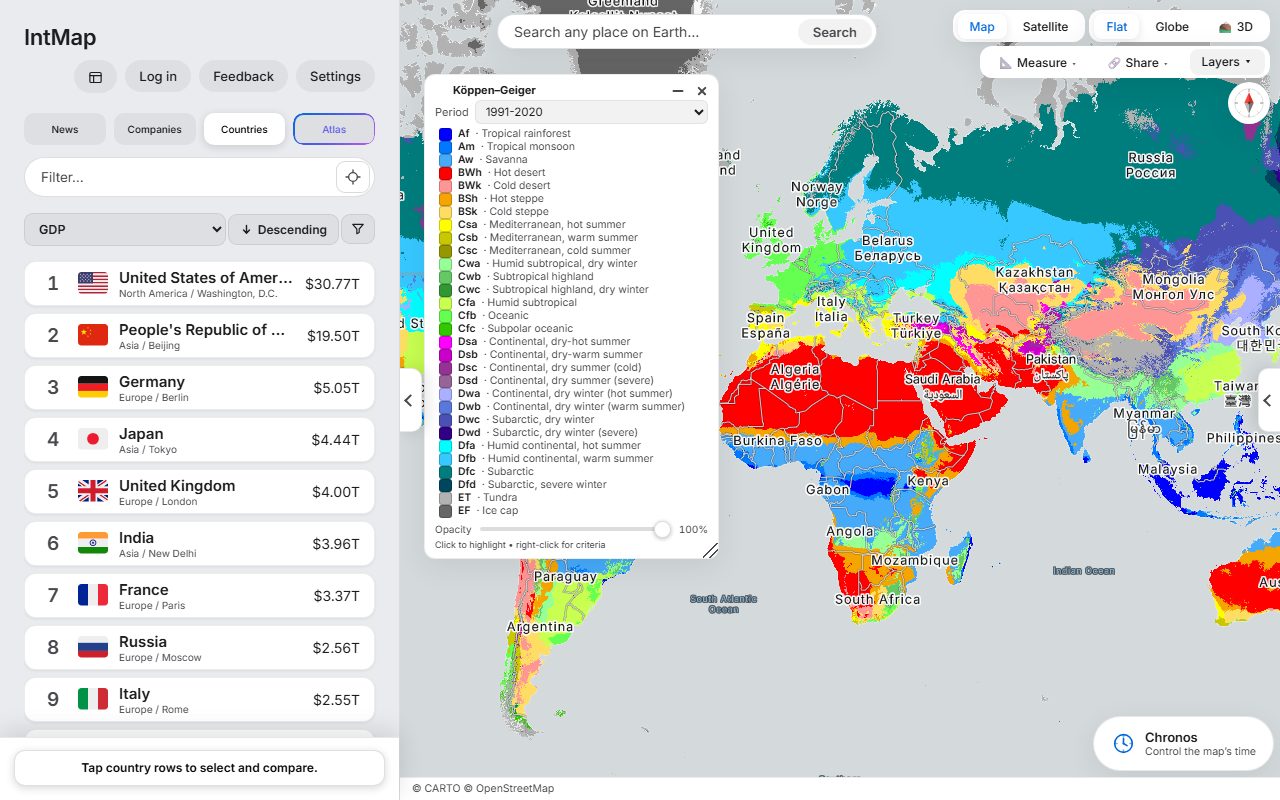
Open this map →The Köppen–Geiger climate classification of Beck and colleagues, for 1991–2020.
Open this map →The year the last of the Song fell to the Great Khanate. Beside it, the Ilkhanate, the Chagatai Khanate and the Golden Horde: the empire had already split into four. The historical-basemaps snapshot for 1279.
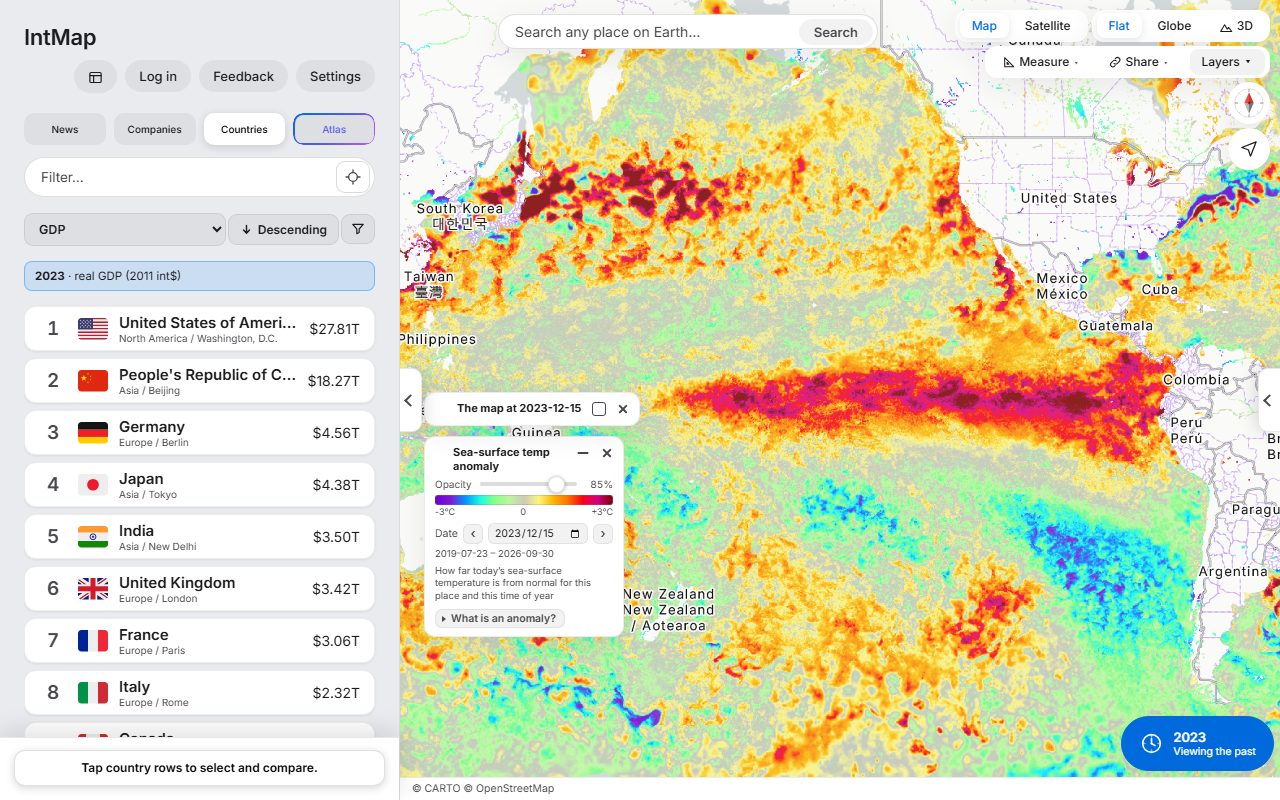
Open this map →How much warmer or cooler than usual the sea surface was that day, at the height of the 2023–24 El Niño: the GHRSST MUR anomaly from NASA JPL, through NASA GIBS.
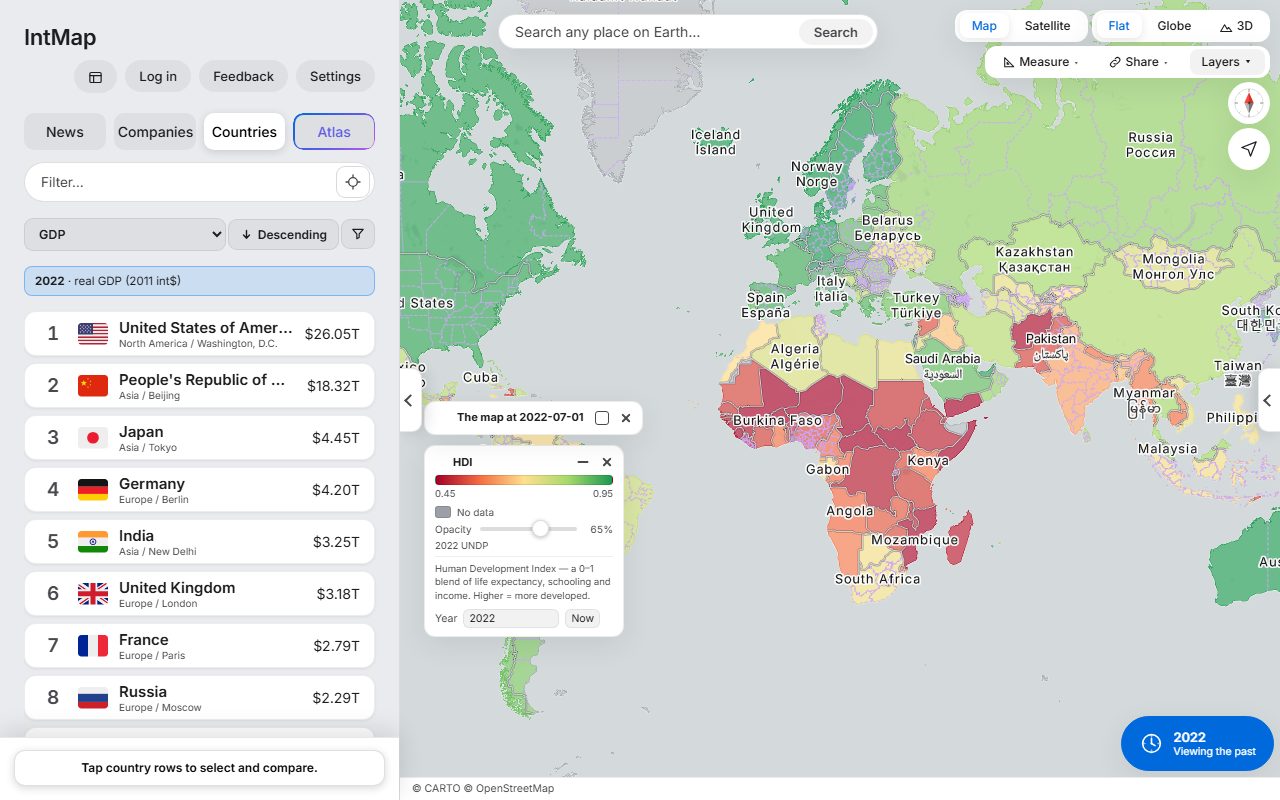
Open this map →Each country coloured by the Human Development Index of the UN Development Programme for 2022 — one number made from life expectancy, years of schooling and income.
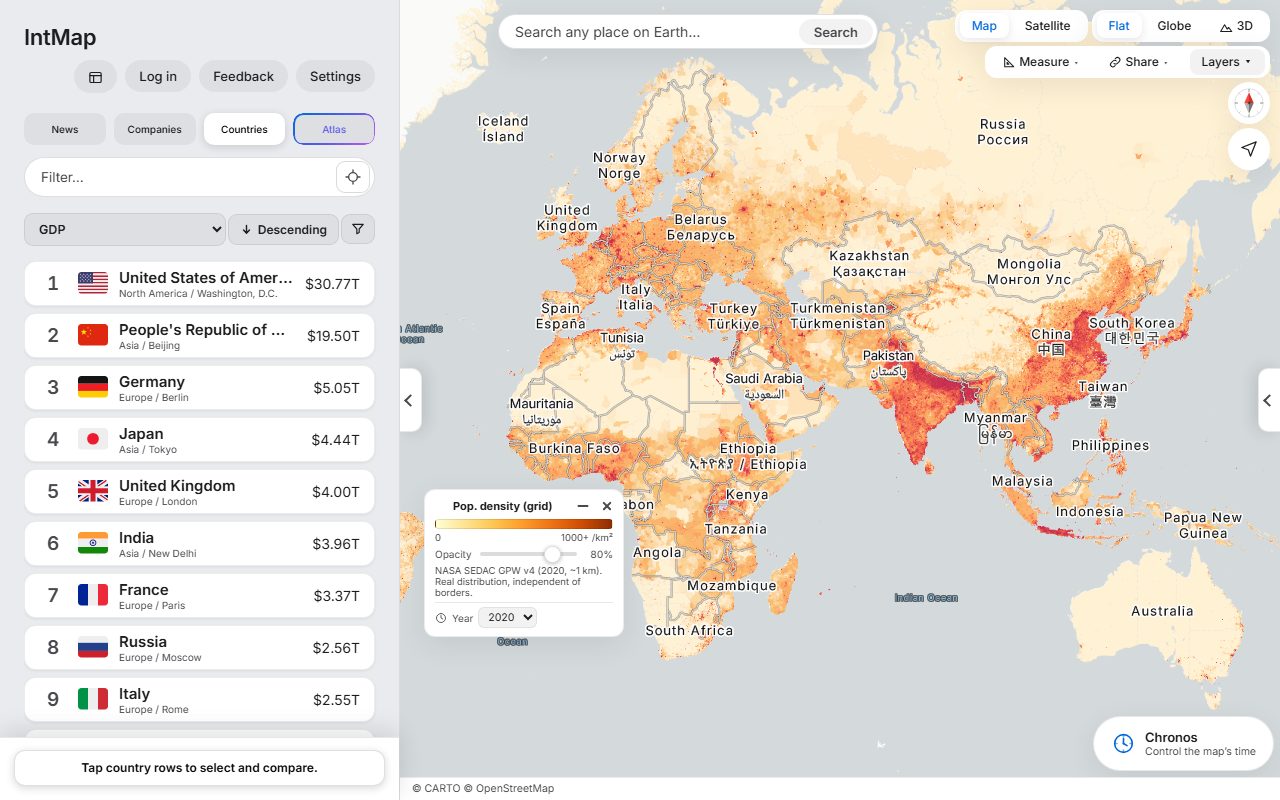
Open this map →Population density from Gridded Population of the World (NASA SEDAC), for 2020.
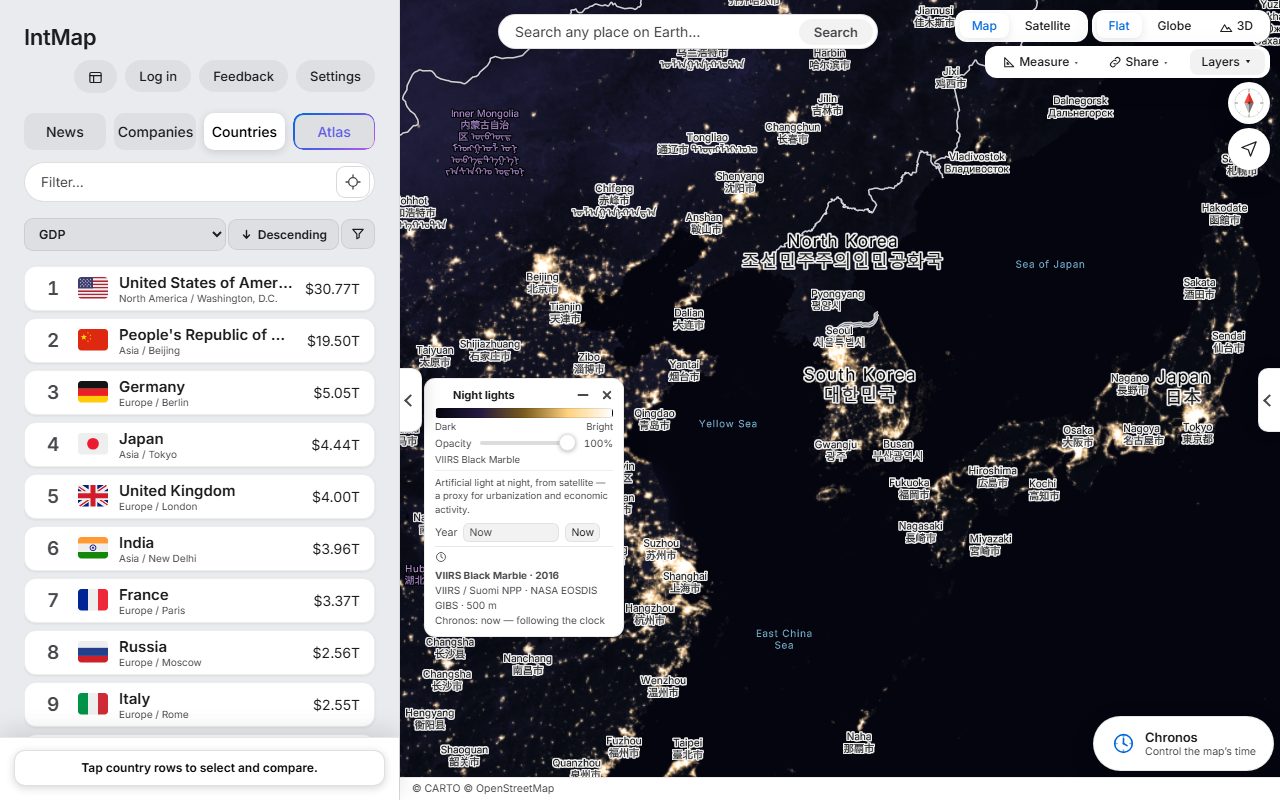
Open this map →The lights of cities, roads and ports seen from space: the VIIRS Black Marble composite of 2016 (NASA).
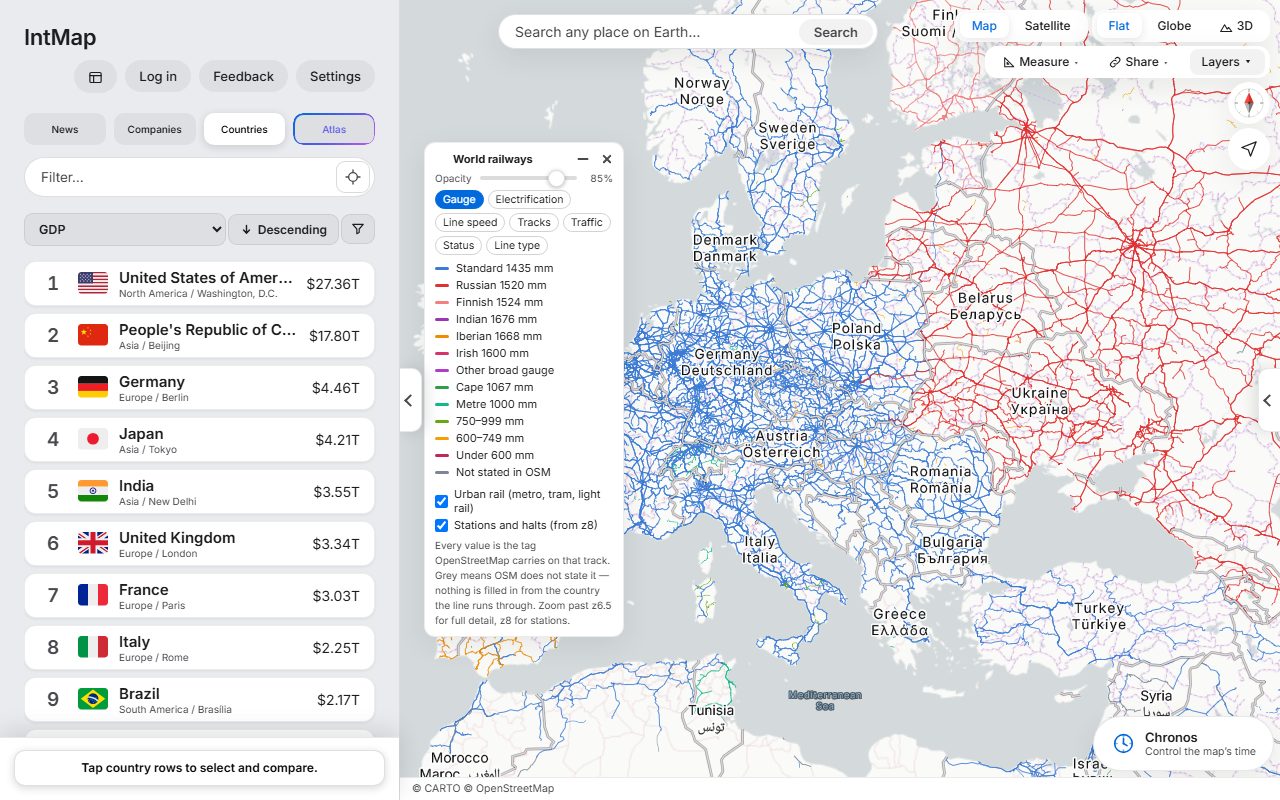
Open this map →Every line coloured by the distance between its rails, as OpenStreetMap records it for that track.
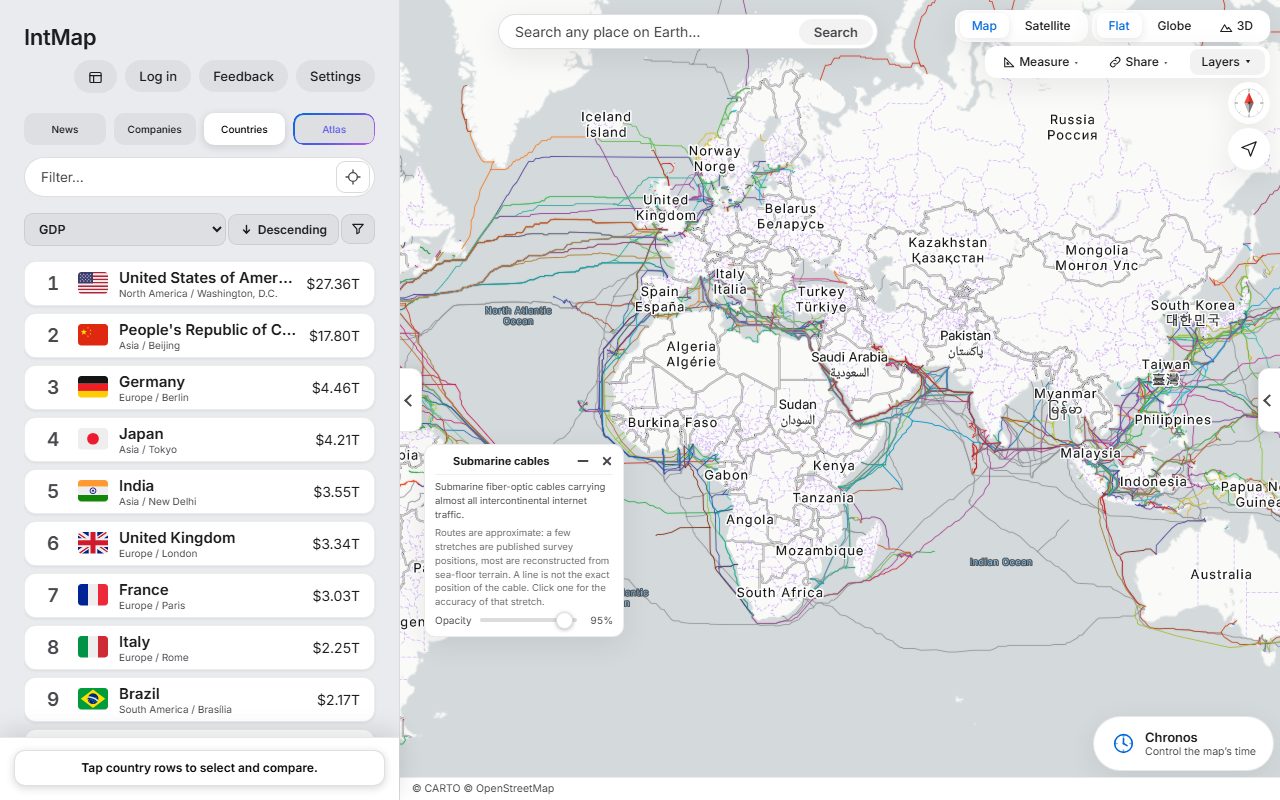
Open this map →The submarine cables that carry the internet between continents: the cables TeleGeography’s Submarine Cable Map lists, on routes reconstructed from the sea floor — a line shows where a cable runs approximately, not exactly.
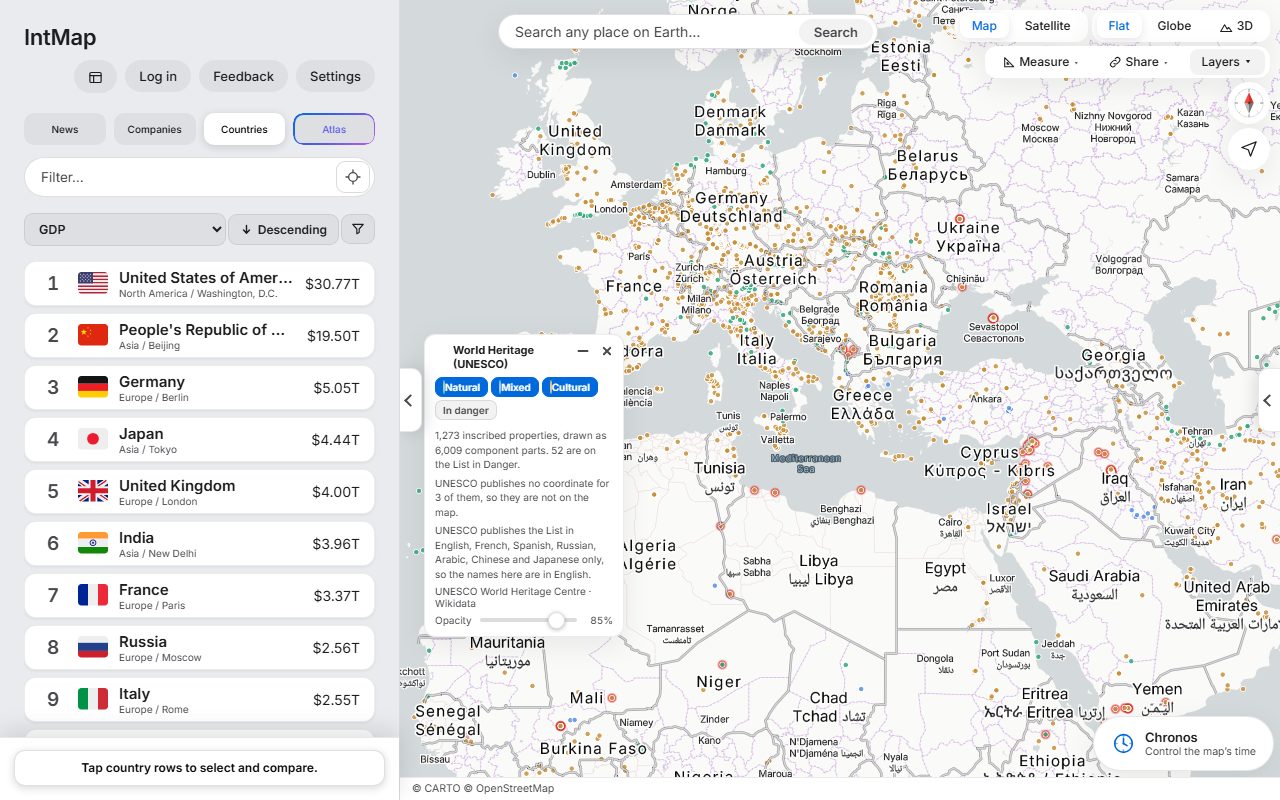
Open this map →Every site on the UNESCO World Heritage List, coloured by whether it is inscribed as cultural, natural or mixed.
Open this map →IntMap is free and has no paid plan. Running it is paid for by donations — if it is useful to you, you can help keep it that way.
Donate ↗Yes. The map, every layer and the clock are free to use. Running costs are covered by donations.
No. Everything on the map works without one. Signing in adds Atlas, the AI assistant (with a daily limit per account), and keeps your settings in sync.
From the organisations that publish it — weather services, NASA, UN bodies, universities, OpenStreetMap and historical-map projects. Every one is listed with its licence on the Data sources page. Data sources →
What each feature and simulation computes, and under which assumptions, is written out on the Science & logic page. Science & logic →
You can use the map without an account. What is stored when you sign in, and which services your browser contacts, is set out in the Privacy Policy. Privacy Policy →
Yes. The Share button gives a link that reopens the same position, zoom, base map, layers and date.